
Keywords: NV Color-centric Lock-in Amplifier Quantum Sensing
Note: This article uses the Sine Scientific Instruments OE1022 lock-in amplifier to make measurements.
[Overview]
In 2021, academician Guo Guangcan's team at the University of Science and Technology of China & Key Laboratory of Quantum Information, Chinese Academy of Sciences (KLQIS) published an article in Review of scientific instruments titled "A robust fiber-based quantum thermometer coupled with nitrogen-vacancy centers", reporting a quantum temperature sensor based on nitrogen-vacancy (NV) centers in diamond.
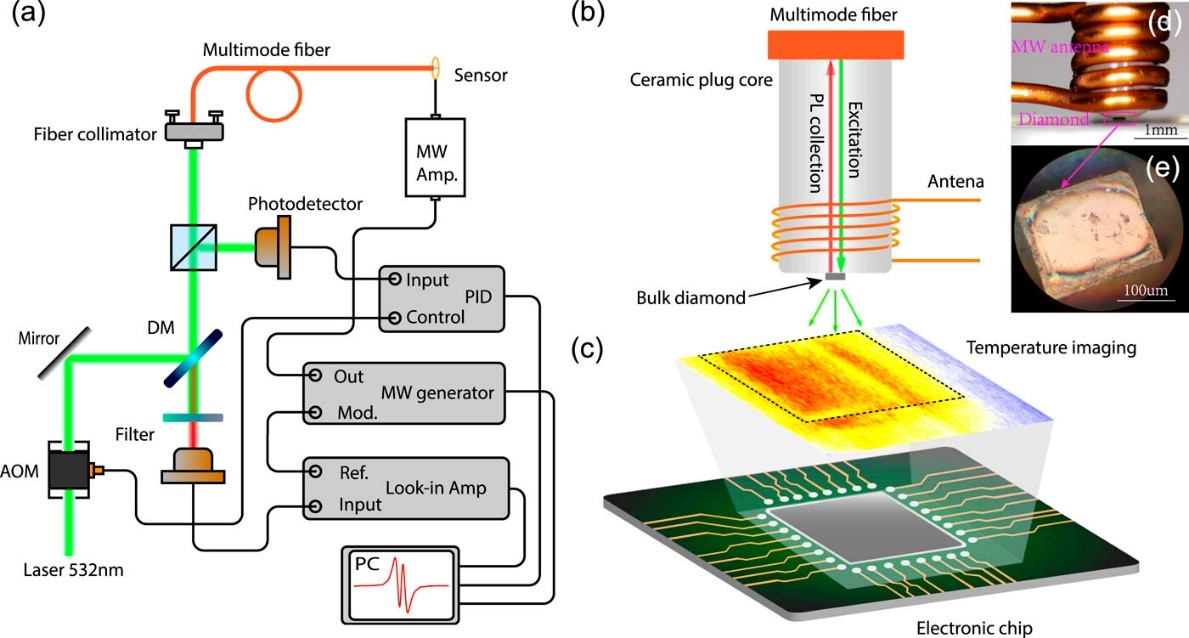
Fig. 1. (a) Schematic of the hybrid fiber optic thermometer device (b) Simplified schematic of the sensor (c) Chip for temperature imaging based on a fiber optic quantum thermometer.
The article proposes to utilize the sensitivity properties of nitrogen vacancy centers in diamond to different physical quantities to design a fiber-optic quantum thermometer, which can effectively isolate magnetic field noise and microwave power drift. The temperature measurement is achieved by detecting the change in the acute inclination angle of the photometric NMR spectra in the high-density nitrogen vacancy cohesion using a frequency modulation method. Due to the simplicity and compatibility of its realization and the robustness of isolating magnetic and microwave noise, the quantum thermometer was subsequently applied to surface temperature imaging of electronic chips with a sensitivity of 18 mK/Hz. A foundation has been laid for realizing high sensitivity temperature measurements in ambiguous environments.
[Samples & Tests]
As shown in Fig. 1(a). The NV center as a whole consists of [N] ≈ 55 ppm and [NV-] ≈ 0.15 ppm, and the diamond is oriented on the [100] surface grown by plasma-assisted chemical vapor deposition. As shown in Fig. 1(b), diamond attached to the tip of a multimode fiber with a core diameter of 100 µm was mechanically polished and cut into films with dimensions of 200 × 200 × 100 µm3. In the experiment, a laser light at a wavelength of 532 nm was coupled into the multimode fiber through an acousto-optic modulator (AOM, AA optoelectronic MT250-A0.5-VIS). Part of this laser light was separated and measured on a photodiode (PD, Thorlabs PDA36A). The signal was then fed to a proportional integral differential controller (PID, SRS SIM960) to stabilize the laser power.
Photoluminescence (PL) collected by the same optical fiber was passed through a 647 nm long-pass filter and finally sent to a photodetector (Thorlabs APD130A2/M). The detected signals were noise filtered and amplified by amplitude modulation (AM) or frequency modulation (FM) of the MW using a lock-in amplifier (LIA, Sine Scientific Instruments OE1022). The output RF signal of the MW generator (Rohde & Schwarz SMB 100A) is sent to the LIA as a reference. In addition, the output MW is sent via a switch (M-C ZASWA-2-50DR+) to a high power amplifier (M-C ZHL-16W-43) and finally through a five-turn copper ring with an OD of 0.5 to the output millimeter wrapped around a fiber-optic ceramic plug core.
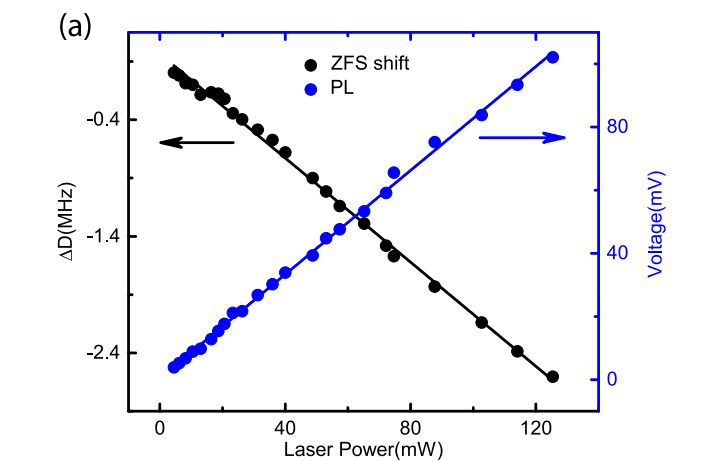
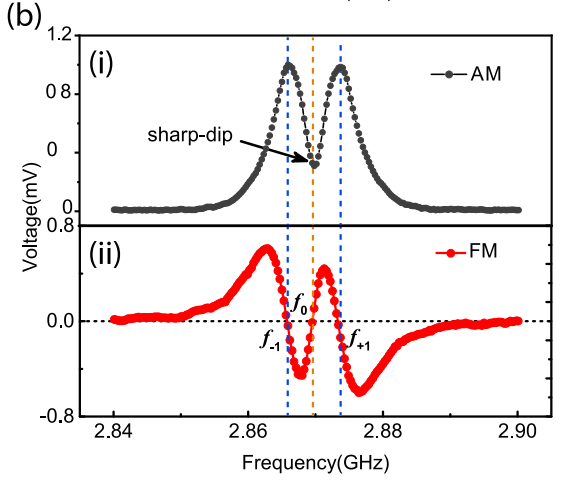
Fig.2 (a) Amount of red fluorescence and ZFS position offset (ΔD) as a function of green laser power. Far from saturation, fluorescence increases linearly with laser power (blue line). The ZFS parameter decreases linearly due to the laser heating effect (black line). (b) CW-ODMR spectra recorded by FM and AM with a single MW source without applying a bias field. (i) The AM spectrum exhibits a sharply inclined structure that cannot be reproduced by double Lorentzian (green) or Gaussian (pink) contours. (ii) The FM spectrum exhibits three typical frequencies of f0;f±1, which correspond to the FM locking signal past zero, thus providing maximum temperature response.
The amount of red fluorescence at the center of the NV was investigated as a function of laser power by modulating the processed AOM with a 333 Hz (lock-in amplifier time constant τ = 30 ms) square wave as shown by the solid blue dots in Fig. 2(a), and a linear fit was performed. In the unsaturated case, the fluorescence increases linearly with laser power. Typically, reaching saturation becomes more difficult as the overall volume and density increase due to the negligible absorption cross-section and inherent power broadening of the individual NV centers. In contrast, the ZFS extracted from the ODMR spectrum decreases with increasing laser power, as shown by the solid black dots in Fig. 2(a). However, for fiber thermometers, the high power pump laser heating effect significantly affects the temperature detection accuracy. Therefore, the laser power must be set below 10 mW. In this case, it is possible to maintain the temperature of the diamond at room temperature and transfer local temperature changes to the diamond for detection using the NV center.
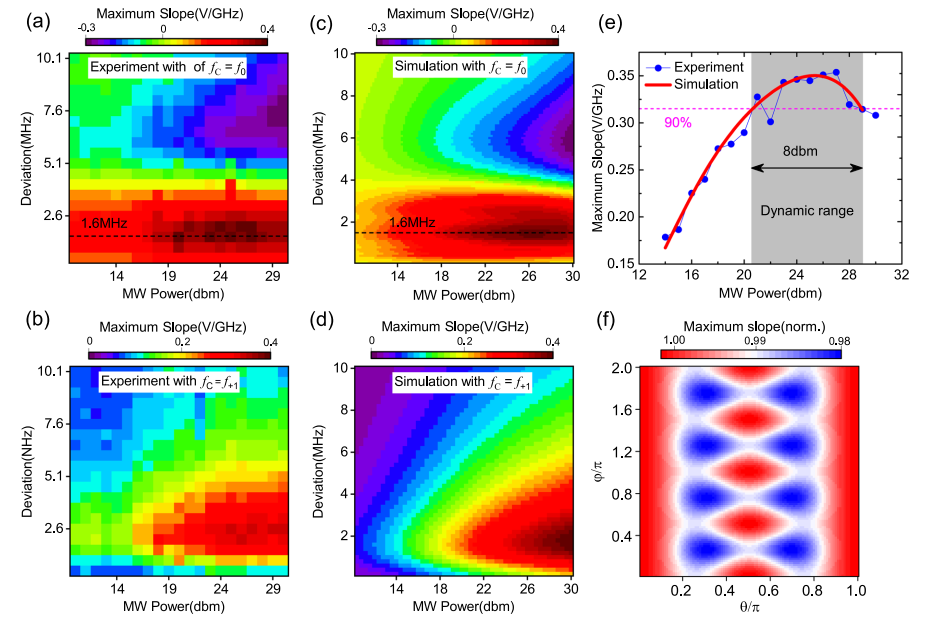
Fig. 3 (a) and (b) Maximum slopes of the FM ODMR spectrum for Sample A as a function of MW power and modulation bias, with the center frequencies fixed at f0 and f+1, respectively. (c) and (d) Simulation results of the equations. (e) Cross sections of the pink dashed lines in (a) and (c). Sensitivity variations of less than 10% in the shaded region indicate the dynamic range of the MW power drift. (f) Maximum slope of the simulated ODMR spectrum, f0 as a function of the vector geomagnetic field. Here, the extracted maximum slope is normalized with the same simulation parameters as in (c) and (d).
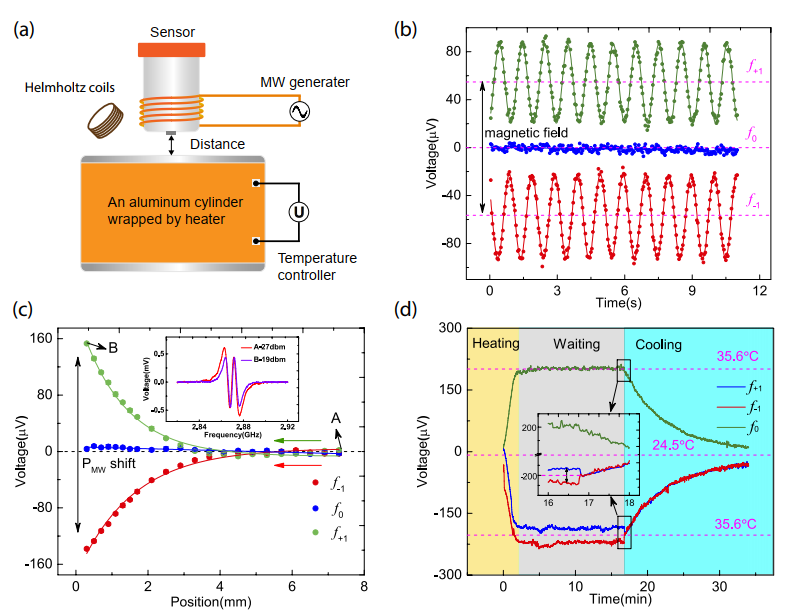
Fig. 4 FM scheme with center frequency f0 to isolate magnetic field noise and MW power drift (a) Schematic of the simplified experimental setup. (b) Signal locked by a Helmholtz coil with a 5.2 μT bias magnetic field oscillating at 1 Hz. Our technique is less sensitive to magnetic noise when the center frequency is fixed at f0. (c) Variation of the locking signal with respect to the distance from the sensor to the aluminum cylinder. (d) Signal measured by the LIA for temperature changes during heating, waiting, and cooling. At 17 min (inset) there is a jump, mainly due to the disappearance of the static electromagnetic field during heating.
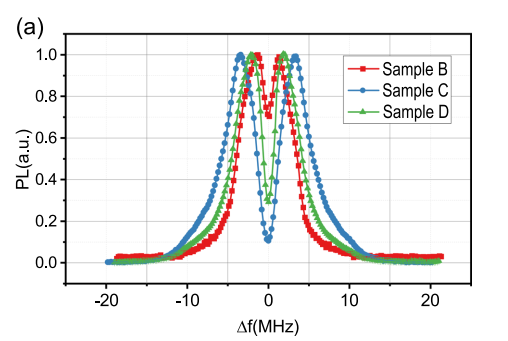
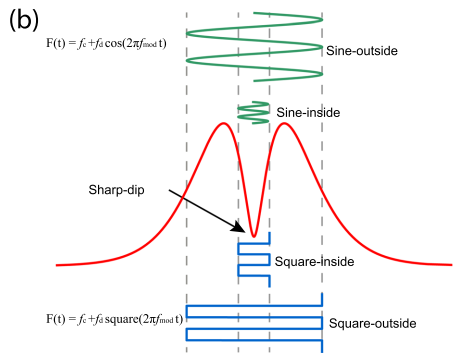
Fig. 5 (a) ODMR spectra of three samples at the same amplitude of MW. (b) The sine-inside, sine-outside, square-inside, and square-outside sensing protocols categorized
by modulation deviation fd and shape.
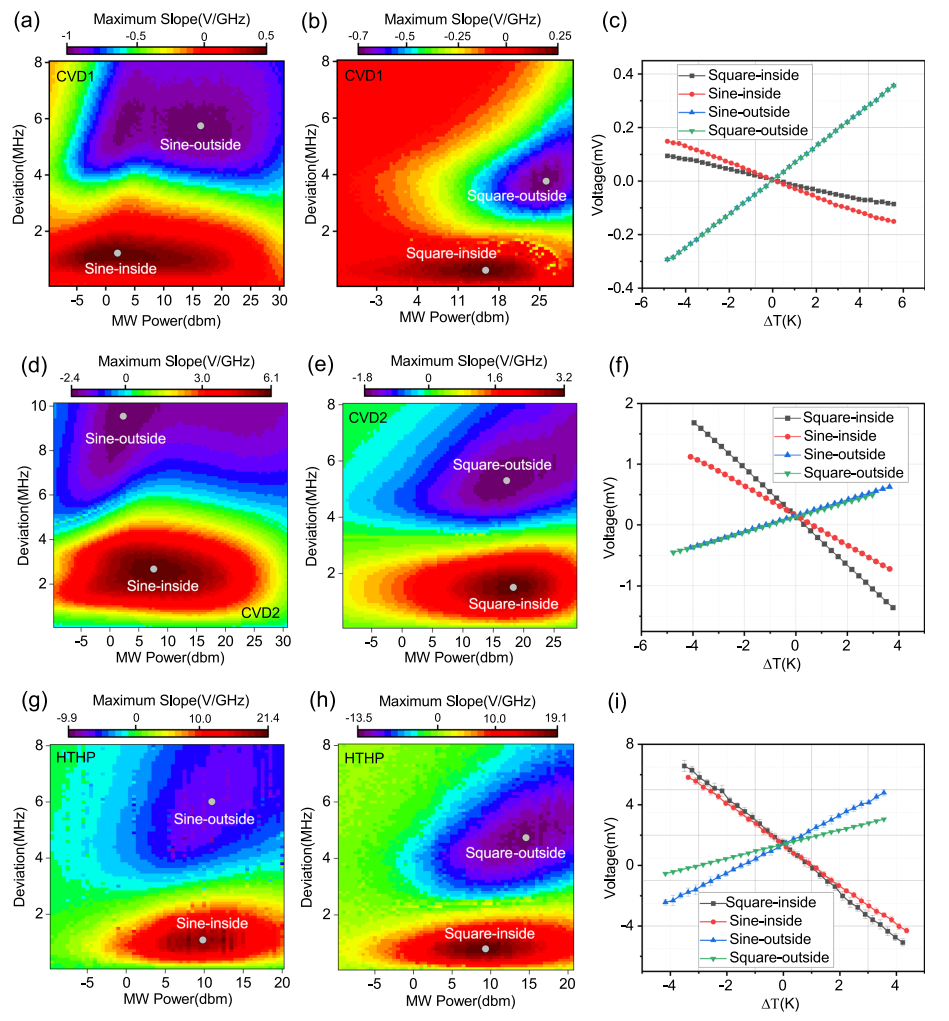
Fig. 6 (a) and (b) Maximum slopes of the locked ODMR spectra for Sample B as a function of MW power and FM deviation. FM MWs using sinusoidal (a) and square-wave (b) modulation shapes. (c) Locked output as a function of temperature change with optimal temperature sensitivity, labeled "sine-inside," "sine-outside," "square-inside," and "square-outside" in Fig. 6(d). " "square-inside," and "square-outside" (a) and (b). (d) and (i) Measurements similar to (a)-(c), except for diamond samples (C and D).
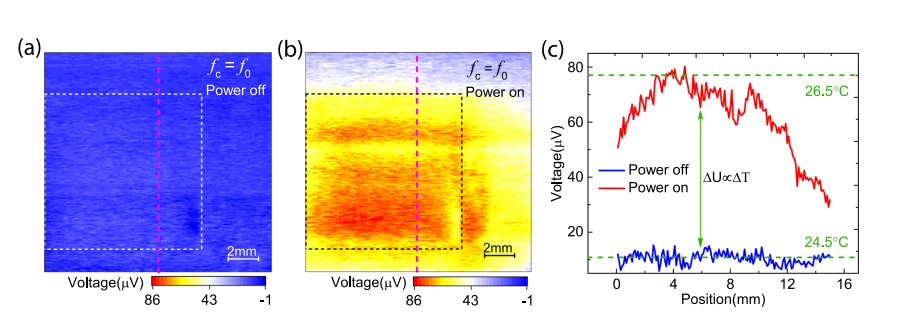
Fig. 7 Temperature scans of an electronic chip (dashed box) with a fixed center frequency of f0.
(a) and (b) Recorded locking signals with center frequency fixed at f0 when the chip is powered off and on, respectively. (a) Cross section of the pink dashed line in (b) and (c).
[Summary]
The sharp decrease of the center located between the spectral resonances of the ODMR is investigated and its enhanced temperature sensitivity is confirmed and a robust fiber optic based thermometer as well as the NV center is proposed. Applying the center frequency in the sharp drop of the FM MW allows a sensitivity of 18 mK/√Hz at room temperature. This approach protects temperature measurements from ambient magnetic fields and MW power drift by single-locked measurements. With the help of a fiber optic-based thermometer, we successfully imaged the surface temperature distribution of an electronic chip. Due to its simplicity and robustness, this quantum thermometer paves an important step towards the practical application of high-precision integrated chips in ambiguous environments and microscale thermal detection in bioendoscopes.
[References]


