Keywords: Laser Aberrometer Stable Isotope Inverse Trajectory Analysis Lock-in Amplifier
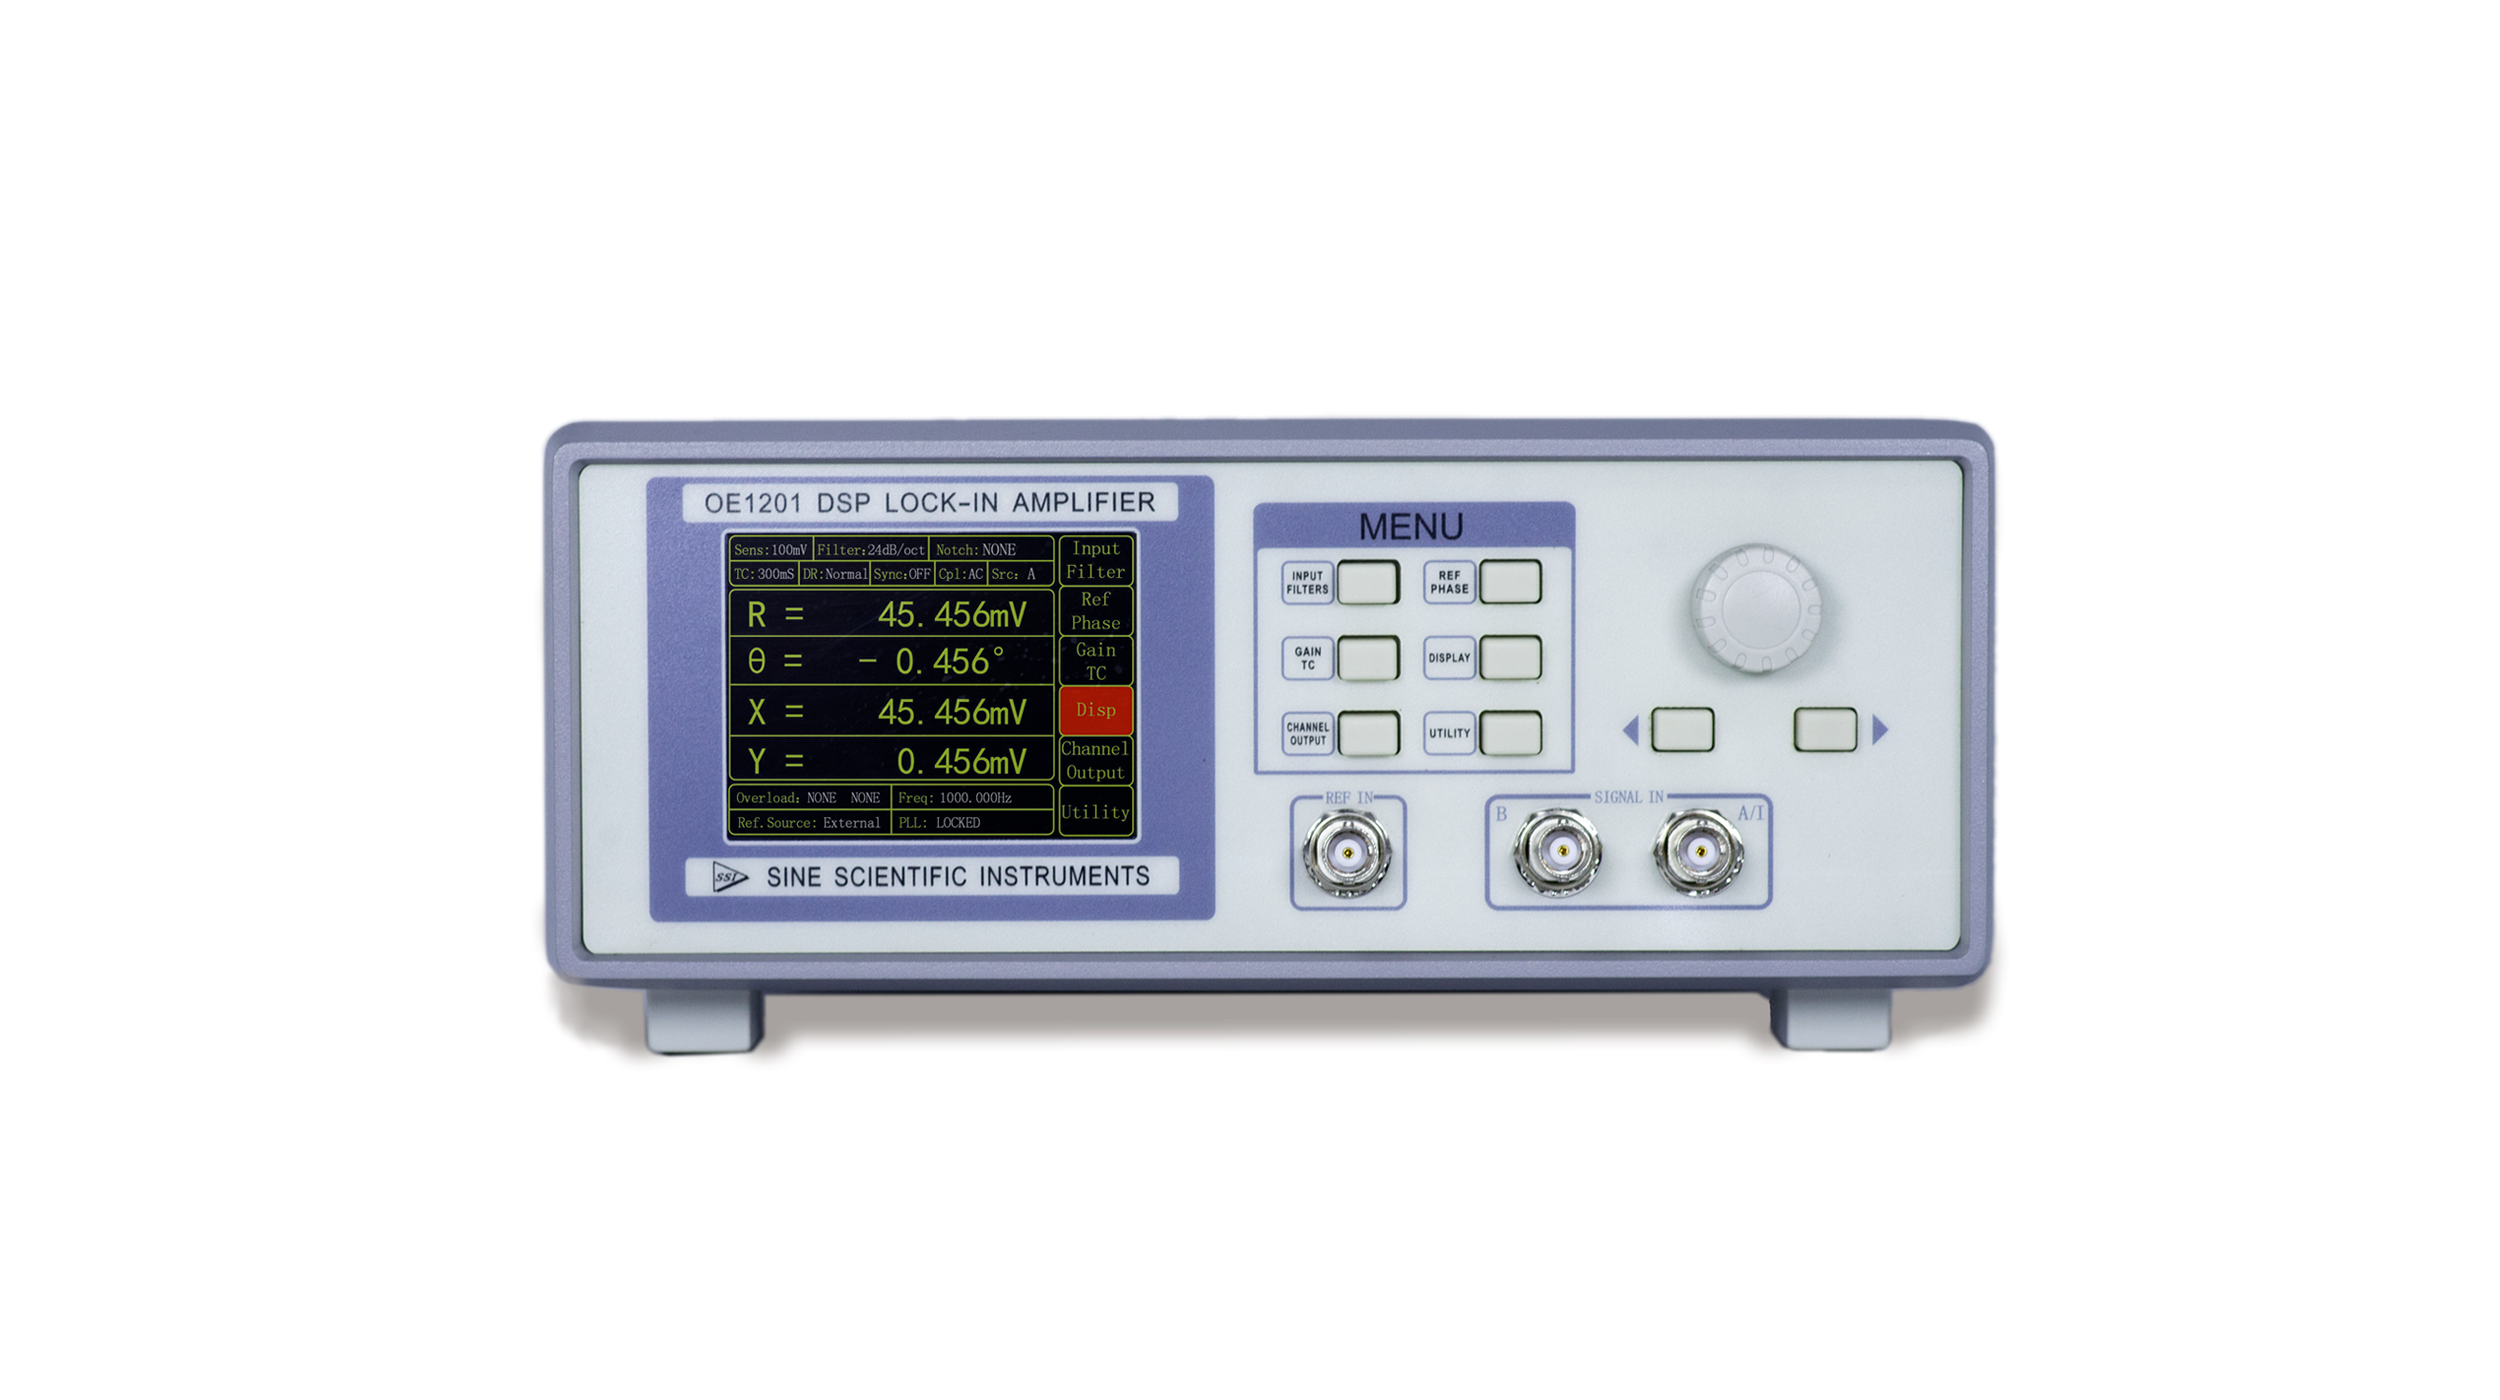
Note: This article uses the Sine Scientific Instruments OE1201 lock-in amplifier to make measurements.
[Overview]
In January 2024, the team of Yinbo Huang and Zhensong Cao from Anhui Institute of Optical Precision and Mechanical Research (AIPPRM), Chinese Academy of Sciences (CAS), published an article entitled "Atmospheric HDO Abundance Measurements in the Tibetan Plateau Based on Laser Heterodyne Radiometer" under the journal Remote Sensing published by MDPI. Plateau Based on Laser Heterodyne Radiometer". The article investigated the relationship between water vapour density and atmospheric motion by analysing the reverse trajectory of atmospheric transport. Prove experimentally that changes in H2O column density and HDO/H2O ratio are related to atmospheric motion.
The Tibetan Plateau (TP) is known as the "third pole" of the world, and its environmental changes profoundly affect the climate in East Asia and even globe. HDO is a stable isotope of water vapour, which is an ideal tracer to study the water cycle, and is commonly used in atmospheric circulation and climate studies. The team of Yinbo Huang and Pengfei Wu obtained the absorption spectra of atmospheric HDO and H2O using a portable Laser Heterodyne Radiometer (LHR) in the Golmud region in August 2019, and detected the densities of HDO and H2O using the optimal estimation method, obtaining an average column density of H2O of 1.22, and a mean column density of H2O of 1.22 during the observation of the The HDO/H2O ratio in Golmud during the period was 178 ± 15 × 10-6.
[Test Methods & Partial Results]
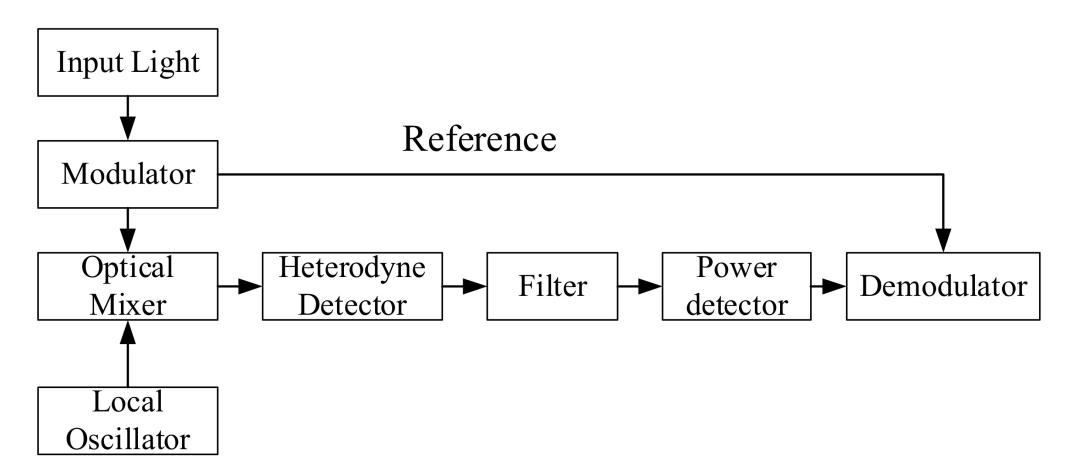
Fig. 1 Flow of laser aberration spectroscopy
The laser outlier spectroscopy technique utilises a narrow linewidth laser mixed with an input optical signal. The Heterodyne Detector (HD) can theoretically produce a total optical current value of:

The ALO and the AS are the amplitudes of the laser signal and the input optical signal, respectively, νLO and νS are the frequencies of the laser signal and the input optical signal respectively, and η is the efficiency of the detector. The second term of Eq. is the mixing signal with a power of:

When the power of the input optical signal is weak, the light intensity information it carries can be amplified by the optical signal generated by the Local Oscillator (LO). The generated mixing signal is filtered, detected and demodulated to obtain the absorption spectral signals of atmospheric gases.
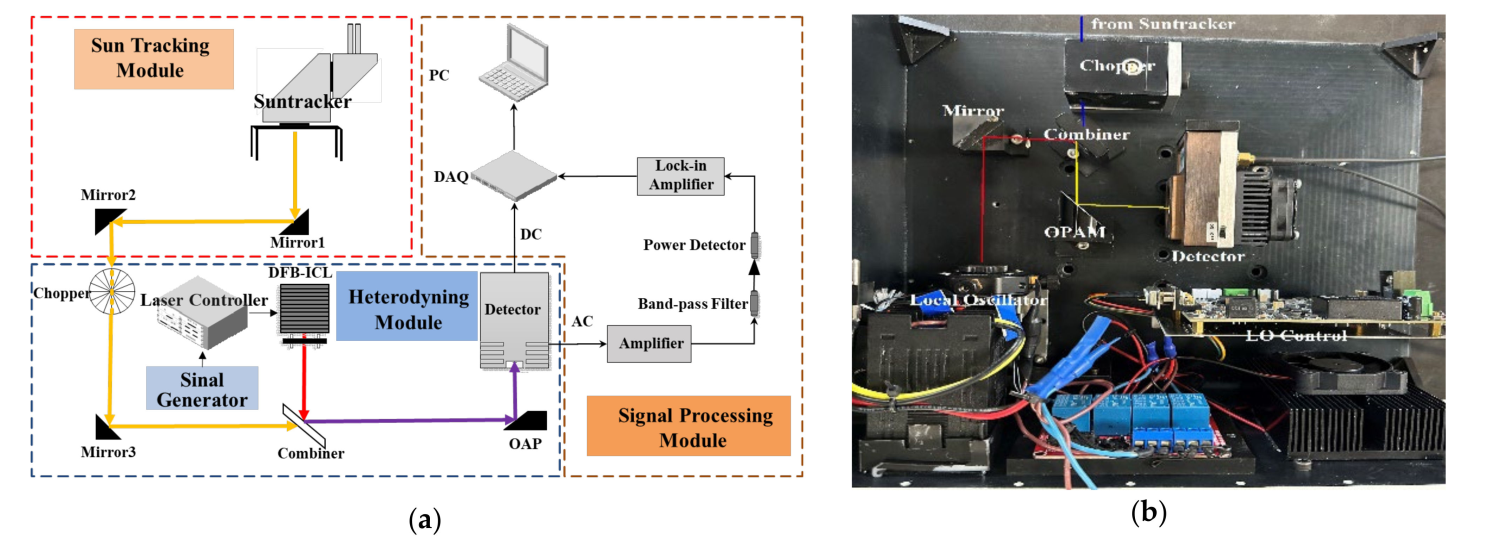
Fig. 2 Layout of (a) laser aberration radiometer and (b) compact aberration model
The laser aberrometer consists of three modules: a sun-tracking module, a frequency-mixing module and a signal-processing module. The sunlight is captured by the sun tracker and mixed with the optical signal generated by the local oscillator. In order to enhance the mixing signal, the mixing ratio of the oscillating light signal and the sunlight signal is approximately the same as that of the laser aberration radiometer, which consists of three modules: the sun tracking module, the frequency-mixing module, and the signal-processing module. Sunlight is captured by the sun tracker and mixed with the light signal generated by the local oscillator. To enhance the mixing signal, the mixing ratio of the oscillating light signal to the sunlight signal is approximately 10% : 90%. The mixed light is focused through an off-axis parabolic (OAP) and fed into a detector. The dielectric signal is then processed by an RF device and demodulated using a lock-in amplifier OE1201(from Sine Scientific Instruments).
The measured mixing spectra were inverted by the Optimal Estimation Method (OEM), a method developed by C. Rodgers and widely used in atmospheric inversion to obtain plausible results with self-defined parameters such as atmospheric layer, number of iterations, and type of iteration.The flow of the HDO and H2O inversion is shown in Fig. 3.
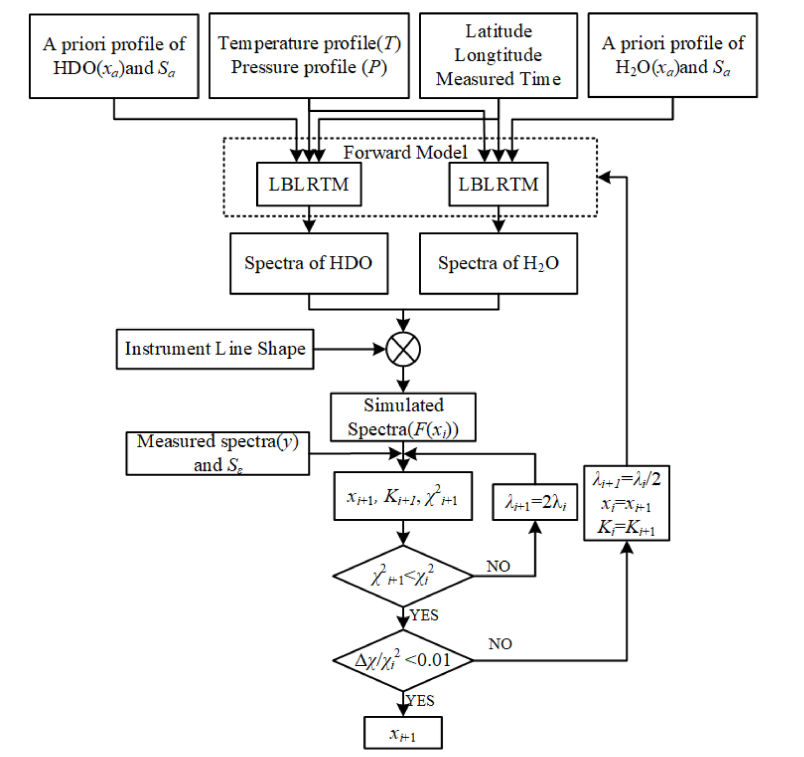
Fig. 3 Inversion flow chart
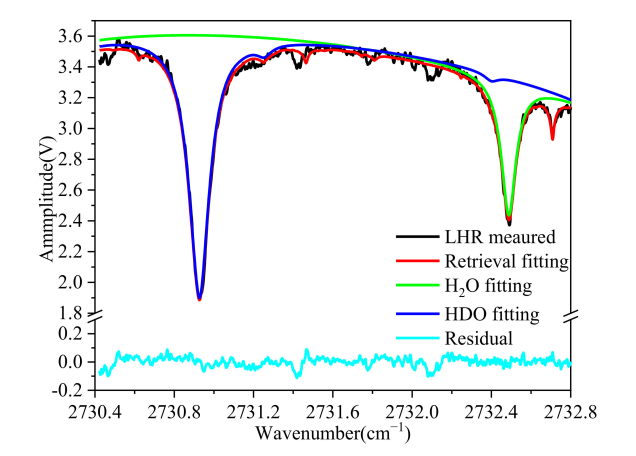
Fig. 4 Measured and inverted fitted spectra
A more accurate fit to the measured spectra was obtained with the OEM method. Absorption spectra of HDO and H2O were obtained separately during the inversion process. One set of measured and inversion-fitted spectra is shown in Fig. 4: the blue line is the fitted spectrum of HDO, the green line is the fitted spectrum of H2O, and the red line is the synthetic spectrum of the inversion fit. The residual spectra are less than ±0.1 V.
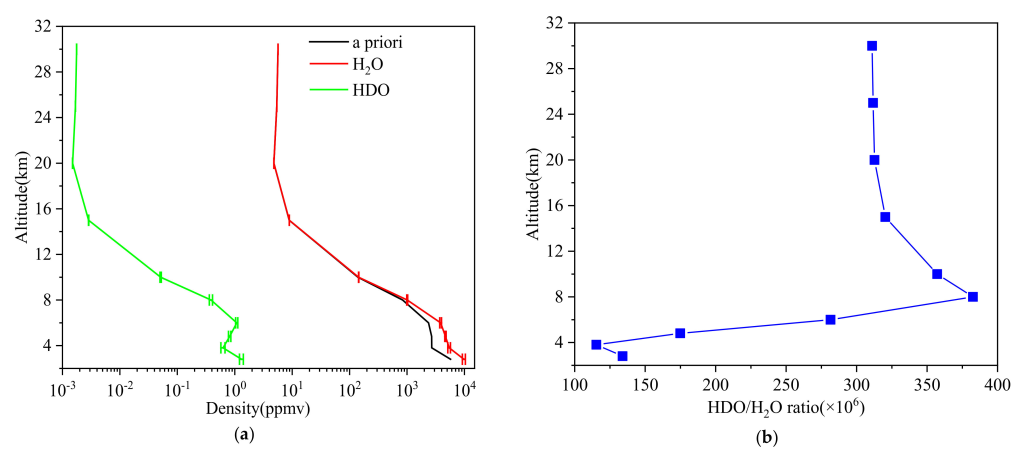
Fig. 5 (a) Curves of a priori profiles, inverse profile changes of H2O and HDO, and (b) curves of the HDO/H2O ratio obtained from measurements on 2 August
The measurements in figure 5 provide information on the distribution of HDO and H2O in the atmosphere up to a range of 10 kilometres. In the upper atmosphere, the densities of HDO and H2O are significantly lower and the sensitivity of the laser aberrometer is not sufficient to detect them. The values obtained by inversion in this range are almost the same as the a priori profiles, indicating that it is possible to use the LAR to invert the H2O and HDO profiles in the lower troposphere on the basis of higher sensitivity and more comprehensive inversion algorithms.
[Summary]
In August 2019, the team of Yinbo Huang and Pengfei Wu successfully acquired the absorption spectra of atmospheric HDO and H2O in the Golmud region using a self-built 3.66 μm laser aberration radiometer, with average column densities ranging from 1.07 to 1.4 g/cm2 , and HDO/H2O ratios ranging from 163 × 10-6 to 193 × 10-6 at Golmud during the observation period.In the spectral study, the team of Huang Yinbo and Wu Pengfei optimised the height intervals during retrieval based on the analysis of the height grid, and reduced redundant information by refining the height layers. Meanwhile, the study uses reverse trajectory analysis to investigate the relationship between H2O (HDO) density and atmospheric motion, and illustrates that the origin and path of the airflow can have an effect on H2O density and isotope abundance based on the observations.
[Literature]
[Recommended Products]


