The AC impedance method is also known as electrochemicalim pedance spectroscopy (EIS) when applied to electrochemical systems. The method involves controlling the current (or potential) through an electrode to vary sinusoidally with time under small amplitude conditions, and simultaneously measuring the pattern of variation of the electrode potential (or current) with time as its response, or directly measuring the AC impedance (or conductance) of the electrode. This method has become one of the most important methods for studying the dynamics of electrode processes and electrode surface phenomena.
After the impedance spectrum data is measured, it is necessary to carry out reasonable data processing, usually using the method of equivalent circuit, that is, each unit step in the electrode process with the equivalent circuit model components on behalf of the electrode process, if the impedance spectrum data is resolved according to the electrode process of the equivalent circuit and its component parameters, you can determine the dynamics of the electrode process mechanism and the dynamics of each unit step parameters.
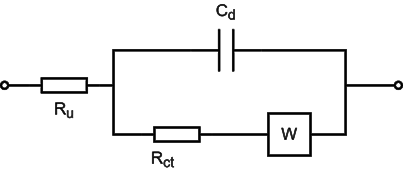
Fig. 1 shows the electrode equivalent circuit of the hybrid control system, where R represents the solution resistance Ru, C represents the double-layer capacitance Cd, Rct represents the charge transfer resistance, and W represents the Warburg impedance.

Fig. 1 Electrode equivalent circuit for hybrid control system
Electrochemical impedance spectroscopy (EIS) is one of the most powerful tools to study the electrochemical processes occurring at the electrode/electrolyte interface, and is widely used to study the process of lithium ion embedding and detachment in the active material of lithium ion battery electrodes.EIS is able to characterise each step of electrochemical embedding reaction in a wide range of frequencies according to the difference in the relaxation time constants of each step of the electrochemical embedding reaction.
The dislodging and embedding processes of lithium ions in the electrode include the following steps: ① electron transport between active materials and lithium ion transport in the electrolyte; ② diffusive migration of lithium ions through the SEI membrane; ③ charge transport process at the electrode interface; ④ solid diffusion process of lithium ions inside the active material; ⑤ embedding and dislodging of lithium ions lead to the change of the crystalline structure of the electrode material or the generation of new phases.

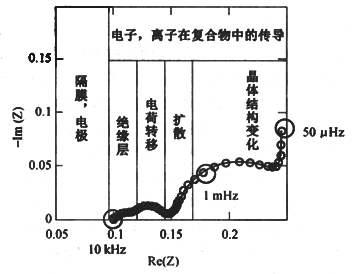
Fig. 2 Impedance spectrum and equivalent fitting circuit for Li-ion battery measurements
According to this process, the EIS spectrum consists of five parts (as shown in Fig. 2): ① the UHF region (above 10 kHz), the ohmic resistance related to the lithium ions and electron mobile transport, which is represented as a point on the EIS spectrum and is expressed as Rs; ② the HF region, which is the diffusion process of lithium ions penetrating through the SEI membrane, and can be represented by a parallel circuit of RSEI/CSEI. The RSEI is the resistance of lithium ion diffusion and migration through the SEI membrane; ③ the mid-frequency region is the control of electrochemical charge transfer process, which is expressed by a parallel circuit of Rct/Cd. Rct is the charge transfer resistance, and Cd is the capacitance of the double layer; ④ the low-frequency region is the diffusion of lithium ions in the solid state inside the active substance, which is shown as a diagonal line on the graph, and is expressed by Warburg impedance Zw; ⑤ the extreme low-frequency region is the diffusion of lithium ion inside the active substance, which is shown as a point on the spectrum, and is expressed by Rs. low-frequency region.

Fig. 3 Typical electrochemical impedance spectra of lithium ion detachment and embedding processes in electrodes
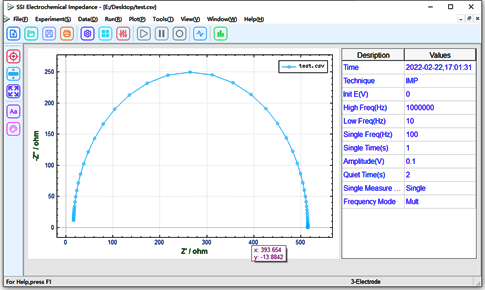
A simulated electrolytic cell is constructed with capacitors and resistors according to Fig. 1, where Ru = 16Ω, Cd = 4.7nF, and Rct = 499Ω. The real and imaginary parts of the equivalent resistance of this electrolytic cell are measured by SE1106 using EIS, and the upper computer represents it using a Nyquist diagram, as shown in Fig. 4 below.

Fig. 4 electrochemical impedance spectra of the simulated electrolytic cell model
In this experiment, the electrochemical impedance spectra of a simulated electrolytic cell composed of resistance and capacitance are measured and resolved first, and then the electrochemical impedance spectra of a lithium-ion battery are measured and resolved.


