Constant current charging and discharging method, also known as timing potential method. Its basic working principle is to charge and discharge the tested electrode under constant current conditions, record the change rule of its potential with time, and then study the electrode's charging and discharging performance and calculate its actual specific capacity.
Constant current charge/discharge test can determine the charge/discharge curve of the electrode material, the level of specific capacity, multiplier characteristics, cycle performance and other parameters. Usually, it adopts constant current charging first, then constant voltage charging, and constant current discharging after a period of time. When charging, set the charging current according to the size of the specific capacity of the battery and the discharge multiplication rate, and then charge with constant current to the set voltage, and then use the test system to automatically jump into the constant voltage charging. After constant voltage charging for a certain period of time, it will be left to stand still, and then constant current discharge to the set safety voltage, and the setting of constant current discharge is similar to that of constant current charging. It is best to test in a relatively constant temperature environment, cycle many times in order to stabilise the data.
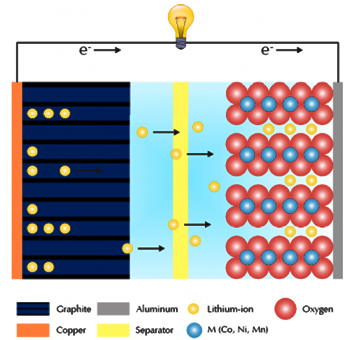
Figure 1 shows a typical lithium-ion battery setup and an overview of the electrochemical processes during charging.

Fig.1 Brief schematic diagram of lithium ion during charging.
To achieve higher power and energy densities, highly porous materials are used as electrode materials. At the anode, graphite is adhered to the copper foil of the current collector. At the cathode, lithium transition metal oxides adhered to an aluminium foil are mostly used.
Electrolytes mainly enable charge transfer between two electrodes. Liquids, solids or polymers are available. A diaphragm - an ion-permeable film - is placed between the two electrodes to prevent electronic short circuits.
During charging, lithium ions migrate from the lithium-rich cathode side to the anode and are inserted into the multilayer structure on the anode side. This electrochemical process is reversible during discharge. The following chemical equation summarises these two processes and illustrates the charging process through a forward reaction.
Anode: xLi+ + xe- + C6 ↔ Lix C6
Cathode: Lix+y MO2 ↔ xLi+ + xe- + Liy MO2
The performance and lifetime of lithium-ion batteries depend on several parameters. Extreme temperatures may lead to degradation of materials. Exceeding the specified values of the battery rating, such as voltage, charging or discharging current, can lead to irreversible reactions and cause the battery to overheat. The overall performance of the battery will also decrease dramatically.
Charge and Discharge Curves
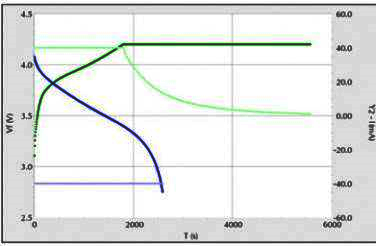
Figure 2 shows a typical charge (green) and discharge (blue) of a coin cell. The voltage (dark) and current (light) are plotted against time. The battery is charged and discharged at a current of 40mA and a voltage between 2.75V and 4.2V.

Fig.2 Coin cell charge and discharge curves. (●) charging, (●) discharging.
The voltage increases steadily during the charging process. During this process, lithium ions are withdrawn from the cathode and inserted between the graphite layers of the anode.
The constant potential of the battery is maintained at 4.2 V after the upper voltage limit has been reached, and this process continues until the current reaches 0.4 mA corresponding to a capacity multiplier of 0.01. This ensures that the battery is fully charged. The state of charge (SOC) of the battery is 100%.
The voltage drops rapidly at the beginning of the discharge process. According to Ohm's law, the voltage drop ∆U (also known as ‘IR drop’) is directly proportional to the equivalent series resistance (ESR), as shown in equation 1.
∆U=I∙ESR Eq 1
I is the applied current.ESR encapsulates the electrode, electrolyte, and electronic contact resistance. The lower the drop in voltage U, the greater the output energy E obtained from the battery, as shown in Equation 2.
E=(U0 - ∆U)∙It Eq 2
U0 is the actual battery voltage and t is the time of charging and discharging respectively. The available capacity of the battery reaches its limit when the voltage drops sharply. The discharging process stops when the voltage reaches 2.75V. At this potential, SOC is defined as 0%. The depth of discharge (DOD) is 100%.
Voltages exceeding the rating of the battery should be avoided as much as possible. Electrolyte deterioration or electrode material degradation will result in reduced battery performance and life.
NOTE: Overcharging and discharging the battery is not recommended. This may cause the battery to overheat resulting in a serious accident. Rechargeable and dischargeable batteries that have not been used for a long period of time should be recharged at least once a year to prevent them from being over-discharged.
Battery Cycling
A typical experiment to test the long-term stability of a battery is battery cycling. For this purpose the battery will be charged and discharged hundreds of times and then tested for capacity changes.
Figure 3 shows a standard battery charge/discharge test (CCD). A coin cell battery is first charged to 4.2V at a charge rate of 1.0C (40mA) and then held at a constant voltage for at least 72 hours or if the voltage reaches 1mA. The battery is then discharged to 2.7V at a discharge rate of 1.0C. The experiment is repeated for 100 cycles.
The dark curve shows capacity. The lighter curve shows the percent capacity compared to the initial.

Fig. 3 Coin cell CCD experiment over 100 turns. (●) Charging, (●) Discharging.
Electrolyte impurities or defects in the electrodes usually lead to a loss of capacity. The test batteries given in this example all show good cycling behaviour. The large capacity of the button cell is roughly 28.7 mAh. capacity decreases only slightly after 100 cycles. The total capacity reduction is about 4.5%.
EIS Testing
The AC impedance method is a method of electrochemical testing using a small amplitude AC voltage or current to perturb an electrode. From the AC impedance data obtained, the corresponding electrode reaction parameters can be calculated based on the tactile equivalent circuit of the electrode. If the imaginary part of the AC impedance at different frequencies is plotted against its real part, the imaginary and real impedance (corresponding to the capacitance and resistance of the electrode, respectively) can be obtained as a curve with frequency, which is known as electrochemical impedance spectrum (electrochemical impedance spectrum-EIS) or AC impedance complex planar diagram.
The basic idea of using EIS to study the electrochemical system: regard the electrochemical system as an equivalent circuit, use EIS to determine the equivalent circuit composition and the size of individual components, and then use the meaning of these electrochemical components to analyse the electrochemical process.
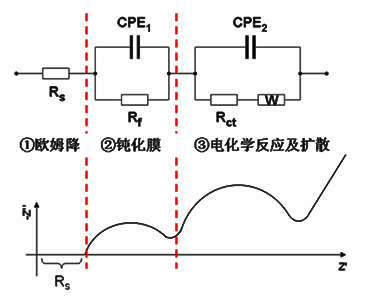
Conventional lithium battery EIS diagram, the cathode material generally does not have the first semicircle, that is, there is no obvious EIS film formation process, the equivalent circuit is not the same as this diagram, as shown in Figure 4:

Fig. 4 EIS diagram of lithium battery
A typical EIS spectrum of the lithium ion detachment and embedding process in a chimeric electrode consists of five components.
(1) The ultra-high frequency region (above 10 kHz), where the ohmic resistance associated with the transport of lithium ions and electrons through the electrolyte, porous diaphragm, wires, active material particles, etc., is represented as a point on the EIS spectrum, and the process can be represented by a resistance Rs.
(2 ) The high frequency region, a semicircle related to the diffusion and migration of lithium ions through the insulating layer on the surface of the active material particles, and this process can be represented by a RSEI/CSEI parallel circuit. Where RSEI is the resistance of lithium ion diffusive migration through the SEI membrane.
(3) The mid-frequency region, a semicircle related to the charge transfer process, which can be represented by a parallel Rct/Cdl circuit, where Rct is the charge transfer resistance, or electrochemical reaction resistance, and Cdl is the capacitance of the double layer.
(4) the low-frequency region, a diagonal line associated with the solid diffusion process of lithium ions inside the active material particles, which can be represented by a Warburg impedance ZW describing the diffusion.
( 5 ) Very low frequency region.


