The experiment was divided into four parts: pretreatment of the specimens, electrodeposition of Zn-Ni alloy coating, corrosion of the specimens observed by metallurgical microscope, and Tafel curve test of the specimens in NaCl.
1. Pre-treatment of Test Pieces
The iron test piece will be cleaned with decontamination powder, and then sanded with 300 mesh, 600 mesh, 1000 mesh water sandpaper in turn, so that the surface of the test piece is clean and flat, and then after hydrochloric acid (1 : 1) acid washing, tap water washing, distilled water washing, drying the water with a filter paper, and then blowing it dry with a hot air blower, and then standby.

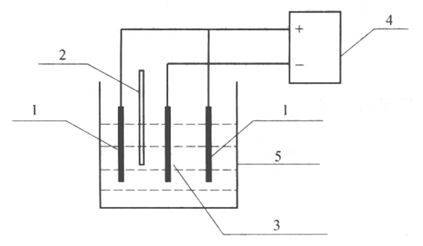
Fig.1 Electroplating unit diagram
1 anode; 2 a thermometer; 3 a cathode; 4 a constant current source; 5 a plating bath
2.Plating Zn-Ni Alloy
(1) Preparation of Zn-Ni plating solution.
The following formula was used to prepare Zn-Ni plating solution, add a certain amount of deionized water to the beaker, add the weighed chemical reagents sequentially under magnetic stirring until complete dissolution, transfer to a volumetric flask to set the volume.
NiCl2- 6H2O |
120 g- L-1 |
ZnCl2 |
100 g- L-1 |
KCl |
190 g- L-1 |
H3BO3 |
25 g- L-1 |
CH3COONa |
90 g- L-1 |
C12H25SO4Na |
0.06 g- L-1 |
pH value |
4.8~ 5.2 |
(2) Plating.
The steps for electroplating a Zn-Ni alloy layer are as follows: preheat the prepared Zn-Ni alloy electroplating solution, heat the plating tank to 40 ℃ in a constant temperature water bath, add hydrochloric acid, adjust the pH value to 4.8 ~ 5.2, hang two zinc anode plates and iron sheets into the electroplating tank, connect the power supply according to the way shown in Figure 3.16.1, calculate the required current based on the current density of 3+A·dm-2, turn on the power switch, adjust the current size, start electroplating, and the time is 15+min. A total of 2 pieces were electroplated.
3. Passivation of Zn-Ni Alloy Coatings
(1) Use the following formula to prepare passivation solution, add a certain amount of deionized water to the beaker, add the weighed chemical reagents sequentially under magnetic stirring until completely dissolved, transfer to a volumetric flask to set the volume.
Na2MoO4- 2H2O |
12.5 g- L-1 |
Na2SiO3- 9H2O |
5 g- L-1 |
Na3PO4-12H2O |
12 g- L-1 |
NaNO3 |
25 g- L-1 |
CH2 (COOH)2 |
24 g- L-1 |
C12H25SO4Na |
0.06 g- L-1 |
pH value |
3.5 |
(2) Passivation of Zn-Ni Alloy Coatings.
Preheat the passivation solution to about 48 ℃, add 20% NaOH solution dropwise to adjust the pH value to about 3.5. Immerse the specimen plated with Zn-Ni alloy in the passivation solution, shake it gently for about 125~130 s, remove it from the passivation solution, age it in air for 10 s, rinse it with tap water, then rinse it with distilled water, and blow dry it with a hair dryer.
4. Observe the Surface Morphology of the Specimen with a Metallographic Microscope.
(1) Take photos of the scale at 400x and 800x magnification: turn on the power of the microscope, turn on the computer, start the digital monitoring system software AverCap, align the objective lens with the position of the scale on the glass slice, and adjust the focal length of the objective lens with coarse and fine adjustments successively in Preview mode to obtain a clear image of the scale, with the length of each small frame being 10μm. click Capture Signal Frame to capture the image, and click File-Save Signal Frame to store the photo. Capture+ Signal Frame to capture the image, and click File-Save Signal Frame to save the photo.
(2) The surface morphology of the iron sheet, the Zn-Ni alloy coating, and the Zn-Ni alloy coating after passivation were observed at 400 and 800 times magnification, respectively, and digital photographs were taken.
5. Determination of Corrosion Rate by Linear Polarization Technique
This experiment requires testing the Tafel curves of iron sheets, Zn-Ni alloy coatings, passivated Zn-Ni alloy coatings in 3.5% mass fraction NaCl solution and iron sheets in 3.5% mass fraction NaCl solution with added corrosion inhibitor, respectively, and calculating the self-corrosion current densities and self-corrosion potentials of the materials.
The electrochemical workstation was connected to the three-electrode system electrolyzer as shown in Fig. 2. This experiment requires testing the Tafel curves of iron sheet, Zn-Ni alloy coating, passivated Zn-Ni alloy coating in 3.5% mass fraction of NaCl solution and iron sheet in 3.5% mass fraction of NaCl solution with added corrosion inhibitor, respectively, and calculating the self-corrosion current densities and self-corrosion potentials of the materials.
(1) Connect the electrochemical workstation to the three-electrode system electrolyzer as shown in Fig. 2.

Fig.2 Schematic diagram of the electrochemical test setup
(2) Tafel curve test:The system was tested as shown in the list below. The open-circuit potential was tested first, and then the cathodic and anodic polarization curves of the studied electrodes were tested in the range of 1.0 V with the open-circuit potential as the center point at a rate of 1 mV- s-1.

Tatel Curve Test System
Note:Corrosion inhibitor is sodium molybdate, add 0.05 g of sodium molybdate to 150 mL of NaCl solution with a mass fraction of 3.5% and set aside.


