Cyclic voltammetry has the characteristics of simple operation, more information and theoretical analysis, and has been widely used in electrochemical research. More information can be obtained by cyclic voltammetry analysis, and quantitative analysis of peak current can be used to judge the reversibility of the electrode process, and to discuss the electrochemical behavior of unknown electrochemical systems. For example, the reversibility of the electrode process can be judged by the absolute value of the peak potential difference Δφ between the cathode and the anode and its change with the scanning speed v .
Cyclic voltammetry can be used to measure the microvariable current generated by the electrochemical reaction of metals in solution . The potentiostat in the chemical impedance analyzer SE1106 is connected to the solution, the Ag rod is used as the working electrode as the research object, the auxiliary electrode is to make the current flow on the working electrode, and the reference electrode can avoid the polarization effect caused by the solution itself , use the host computer to set a certain period of sawtooth wave to obtain cyclic voltammetry.
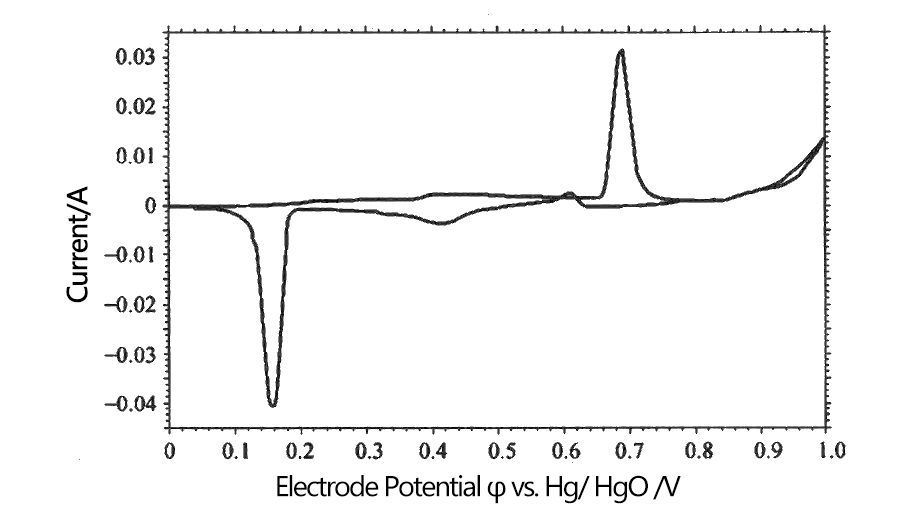
Taking the electrochemical reaction of silver wire in KOH solution to measure the cyclic voltammetry curve as an example, learn to use cyclic voltammetry to study the electrochemical behavior of electrodes. Silver wire electrodes at 7 mol·L-1KOH solution is shown in Figure 1, where the electrode potential is the potential of the Hg/ HgO electrode in the same solution, denoted as φ vs. Hg/ HgO.

Fig.1 Electrode Potential φ vs. Hg/ HgO /V
The current in the first half of the curve increases slowly with the voltage, and a relatively low and gentle current peak appears, which is the anodic current peak when the surface metal Ag is oxidized to Ag2O . When the potential was swept to 0.25 V, the curve then showed a low and flat current peak. Due to the good conductivity of Ag, the Ag2O film produced by the reaction covered the surface of Ag , resulting in the decrease of electrode conductivity and hindering the progress of the reaction. When the potential is swept to 0.65 V, an obvious anodic current peak appears in the curve, Ag2O reacts to produce AgO with extremely low resistivity, the resistance polarization decreases rapidly, and the polarization current increases rapidly. When the potential is scanned to 0.8 V , bubbles escape from the solution, and OH- generates O2 under the action of the potential , which is the current of O2 precipitation.
When the potential was scanned from 1 V to 0.6 V, a cathodic current peak began to appear, which was caused by the reduction of AgO to Ag2O . Since the resistivity of Ag2O was much higher than that of AgO , a smaller cathodic current peak appeared with the reaction. When the potential is scanned to 0.2 V, the second cathodic current peak appears, which is caused by the reduction of Ag2O to Ag , and the polarization is large at this time, which is related to the poor conductivity of AgO . The appearance of the current peak is because Ag2O is gradually converted into Ag with good conductivity , which rapidly improves the conductivity of the motor, and the current rises to a very high value.
It can be seen from the cyclic voltammetry curve that we can see what kind of electrochemical reaction can be carried out on the electrode, at what speed the reaction may proceed, what characteristics the reaction has, and what factors may affect the reaction, etc., so as to explore the electrochemical characteristics of the system. .
Therefore, when studying a position system, cyclic voltammetry is often used for qualitative analysis first.


